Wasting Away
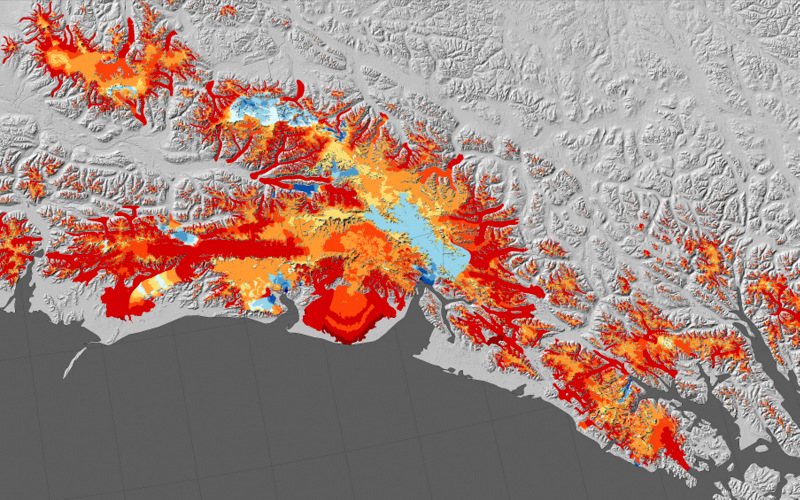
Map of SW Alaska glacier melting, 1994-2013 (credit: NASA)
Melting glaciers and ice caps are the prime sources of rising sea levels worldwide. Whether in Antarctica, Greenland, or Alaska, as ice masses recede melt waters flow directly into the oceans. The flows are accelerating. This is particularly true in the Arctic, the most rapidly warming landscapes on Earth. A nearly 20 year time-line comparison of glacier ice mass was compiled from NASA satellite data producing maps showing the changes. The least melting during the period ia shown in orange, the fastest rates as dark red, and any ice growth in light blue.
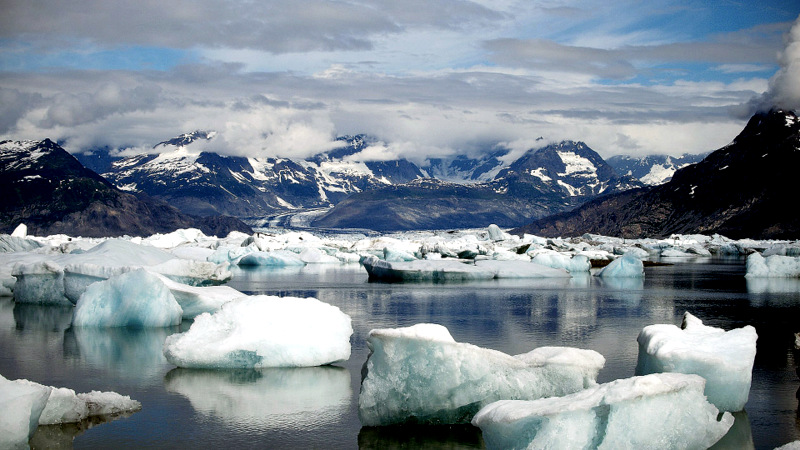
Alaskan glacier melting rates, 1994-2013 (credit: NASA) Glacier Bay icebergs, 7-2008
The maps show the ice changes between 1994-2013 for southwestern Alaska and portions of British Columbia. The 'big data' composites present the total ice balance over the period. The changes represent feet of meltwater equivalent; ie, the depth of water that would result if that ice were to melt. The more red the color, the glaciers have thinned, while blue shows where they have thickened. A sea level view show summer icebergs in Columbia Bay which receives ice flowing from the Columbia Glacier in the out of the Chugach Mountains in Alaska to Prince William Soundout of the Chugach Mountains in Alaska to Prince William SoundChugach Mountains into the bay.
In a report published by Geophysical Research Letters researchers have determined that the region has lost nearly 75 billion tons of ice per year over the monitoring period. That volume represents ~30 percent of the amount of ice thought to be lost each year from the Greenland ice sheet. As a comparison, original climate change models predicted that melting of the Arctic sea pack ice would create an ice-free ocean by the end of the 21st Century. The latest estimates now indicate that summer, ice free condition could happen as early as in the 2020's, nearly 70 years ahead the predictions. A video illustrates some methods used to monitor and gather ice data in the region.
Climate change is accelerating across the Arctic with ice melting from Greenland in August alone contributing enough water to rise sea levels two inches in Florida. Melt waters from Alaska, Canada, and Greenland go directly into the ocean affecting sea levels along many coastal zones in the United States. Monitoring such environmental changes by NASA, NOAA, and other earth science researchers, provides the necessary data to build coastal resilience and make other changes to reduce melting rates, if the information is acted upon.
WHB