OMG, Greenland's Glaciers
3D NW Greenland coast with ocean depths (blue), Ice cap (white), melt water (orange) (credit: UCI)
Greenland's ice cap and glaciers are being investigated by NASA's Ocean Melting Greenland (OMG) program. OMG provides estimates of sea level rise from meltwater due to climate change in the Arctic by addressing a crucial question: To what extent are the oceans melting Greenland’s ice from below? The airborne surveys also measure effects of changing water temperatures on the ice-shelf surrounding Greenland. They will determine how coastal glaciers react with north Atlantic waters and determine the extent warmer water reaches into the island's long fjords and goes under their glaciers. Early findings have been published by Geophysical Research Letters.
According to researchers with the Jet Propulsion Laboratory in Pasadena and UC Irvine who are analyzing the OMG data, topographic maps revealed the coastal seafloor and bedrock beneath Greenland's ice cap: "show that two to four times as many coastal glaciers are at risk of accelerated melting as previously thought". The new JPL-UCI maps are the first comprehensive, accurate, and high-resolution topographic impressions made of Greenland’s bedrock and seafloor. The geologists added: "What made OMG surveys unique is that we get right into the fjords, as close as possible to the glacier fronts, a big help for bedrock mapping. Additionally, we surveyed large sections of the Greenland coast for the very first time."
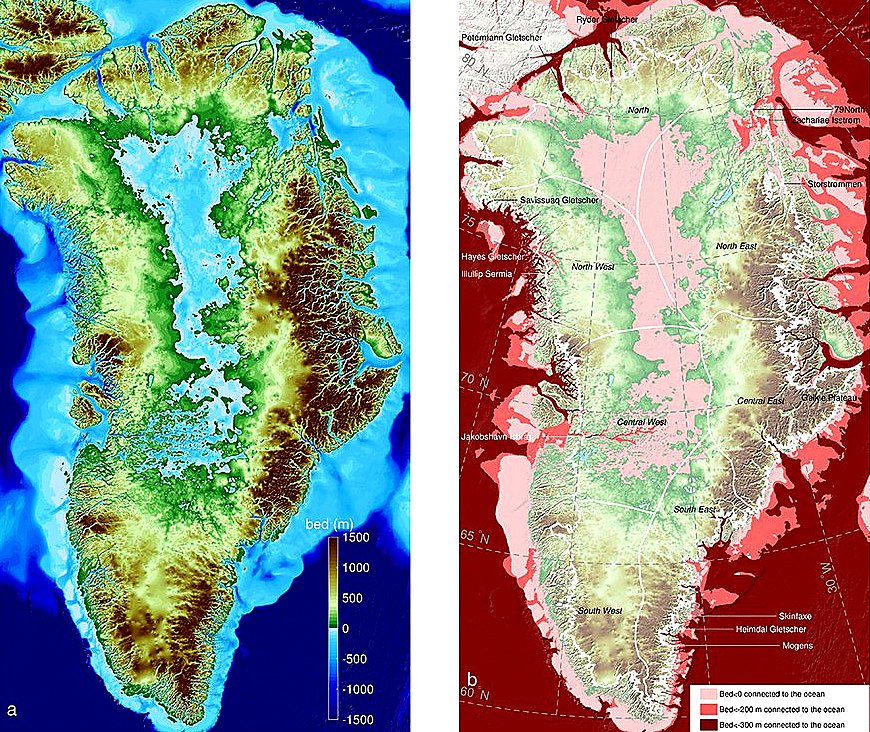
Greenland Bedrock Topography Maps (credit: JPL-UCI)
The OMG data was gathered by especially equipped aircraft carrying scanning devices like an interferometer which can generate high resolution and precision elevation measurements of island’s glaciers. Repeated yearly OMG surveys will determine the extent of thinning or retreat over the previous year. Each summer, a second campaign will deploy temperature and salinity probes to measure the volume and extent of warm waters moving from the Atlantic going in and under the coastal glaciers.
The timing of this new information on Greenland's ice dynamics is critical. NOAA has released a data animation showing the history of atmospheric CO2 levels measured in ice cores stretching back 800,000 years. Atmospheric CO2 sits above 400ppm now. The last time CO2 concentrations were this high in the Earth's atmosphere, humans did not exist, and sea levels were ~18-30 feet higher than they are today. Greenland was also ice free and covered in forests.
OMG is a proper exclamation for the new JPL, NASA, and UC-Irvine ice analysis. WHB