Visualizing Atmospheric Rivers

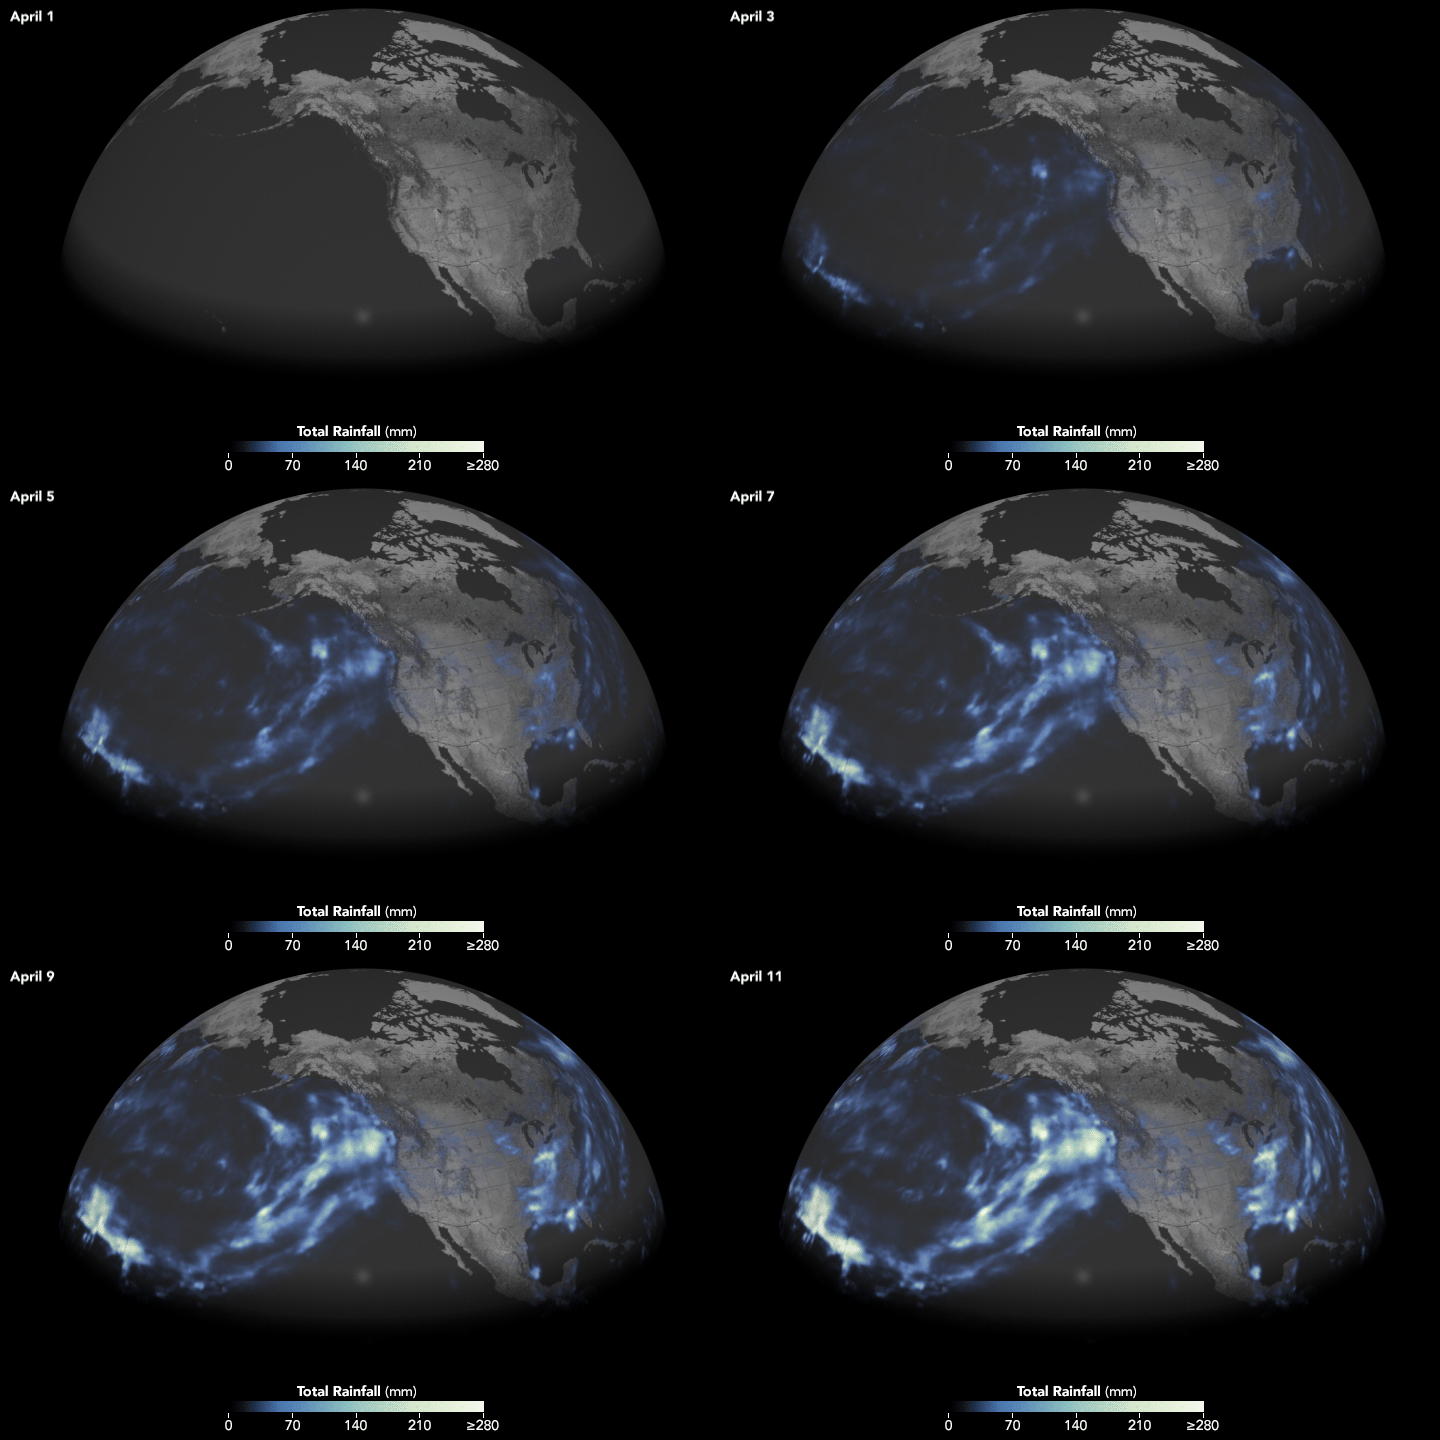
Atmospheric river animation, January 2017 (credit: NASA)
NASA produced an animation using remote sensing, satellite data gathered during the development of an "atmospheric river" that hit the California early in 2017. The dramatic visual shows how such moisture-rich, weather systems form. According to the Agency, the downpours in northern California were caused by one such "river" which transported large volumes of moisture towards the State. These events are vital for replenishing water supplies. When a system reaches the coast, the moisture is released as rain or snow, contributing between 30-50% of annual precipitation. This weather event flowed from the tropical Pacific near Hawaii creating a Pineapple Express. The animation used ten days of satellite data as it was developing.
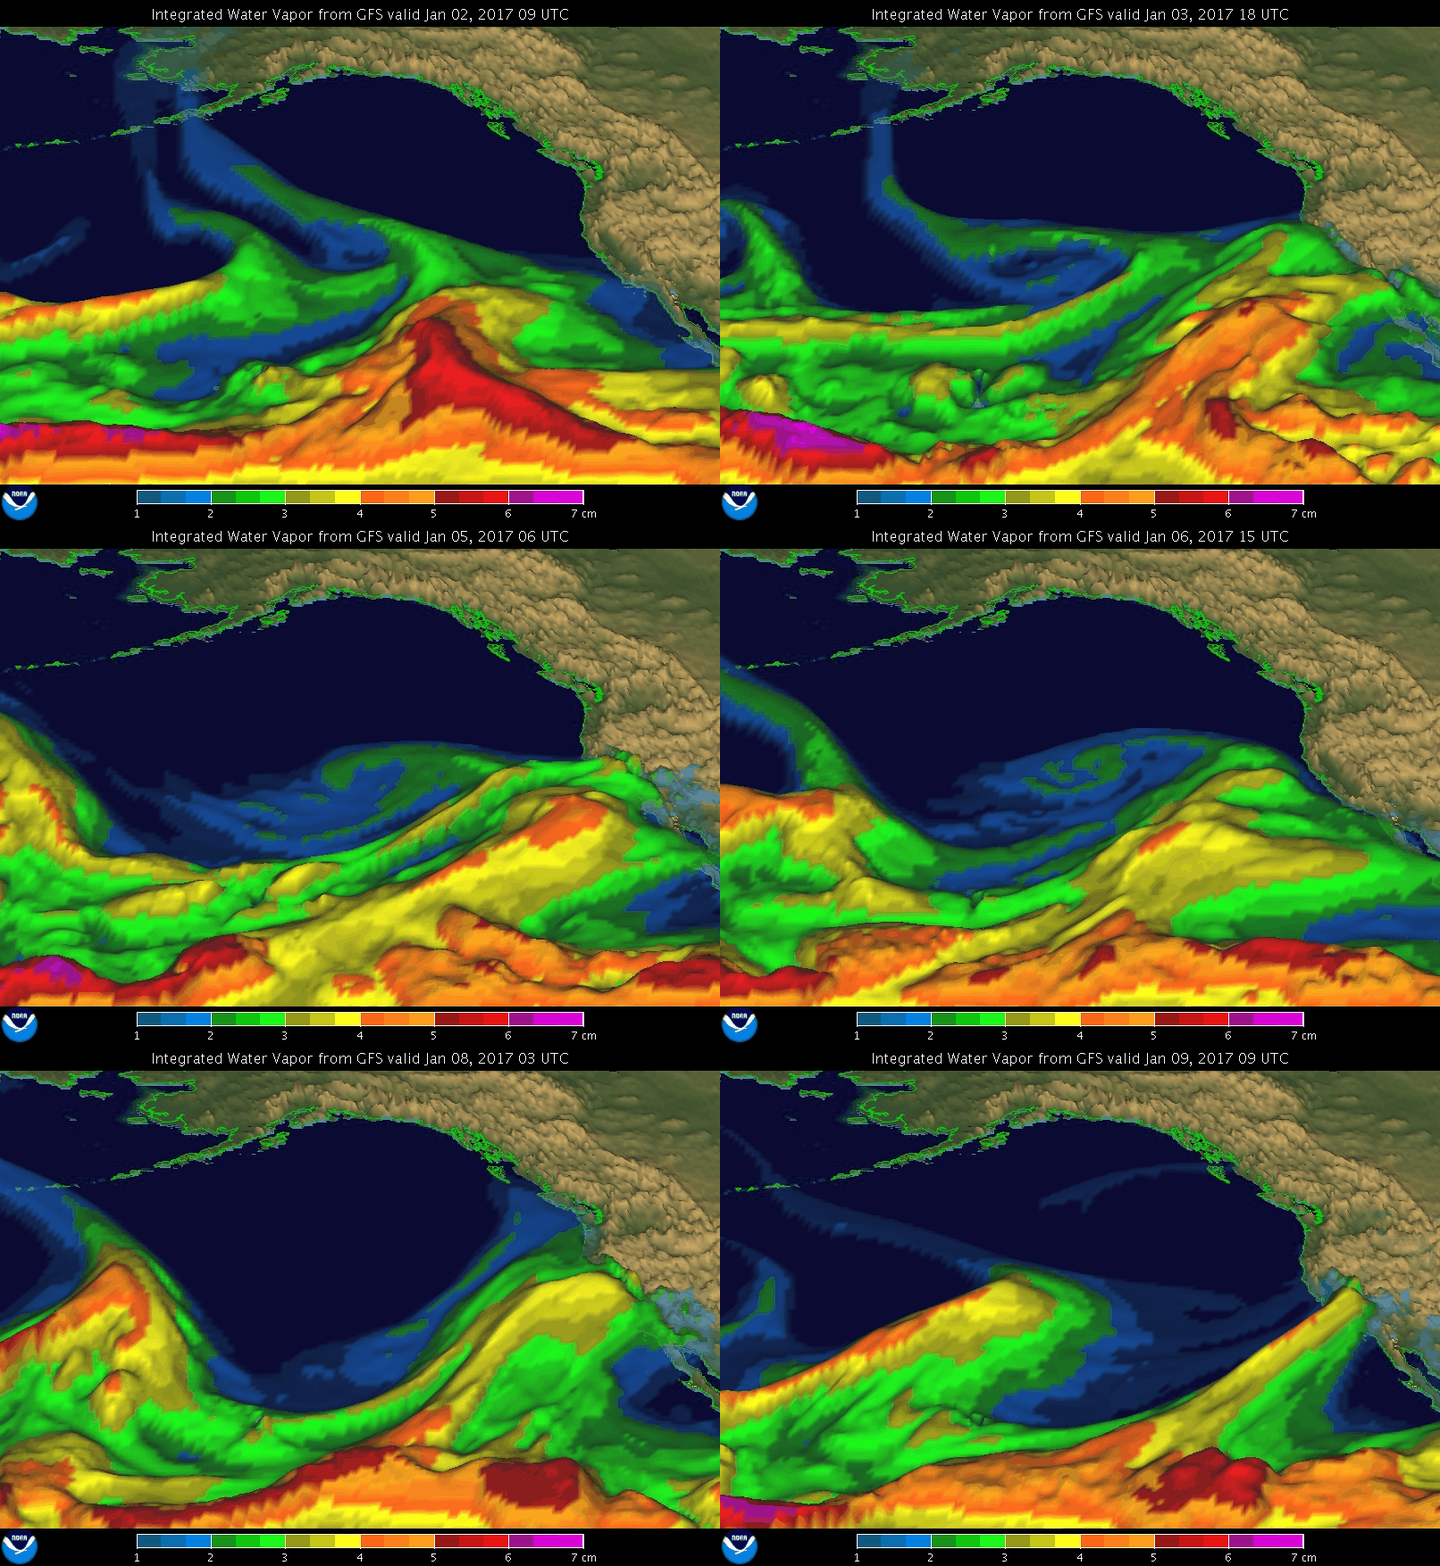
The January storm system brought so much moisture into the previously drought-stricken areas, the water supplies in California were fully restored. NOAA also created a visualization for the first 10 days of January showing the series of pulses that hit the West Coast during that time.

Pineapple Express visualization, 1-2017 (credit: NOAA's Earth Systems Research Laboratory)
With the continuous ability of environmental satellites to gather data, visualizations of complex weather systems are increasingly possible and important. They will allow for improved predictions of pending hazards like floods, tornadoes, and other extreme weather to alert communities in advance. As the atmosphere continues to warm, such scientific visualizations will find many more users.
WHB