Amplified Weather
Wyoming truck stoppage Interstate-80, 10-29-2019 (WY Dept. of Transportation)
A mass of Arctic air has moved into the United States with temperatures reaching lows more typical of Winter than Fall. The National Centers for Environmental Information, part of NOAA, has produced a map showing the predicted regional extent of the temperature anomaly. What makes this such an anomaly is that the frigid air stretches from central Canada to central Texas and from Eastern Indiana to the borders of California and Washington State. Typically the Rocky Mountains act would as a barrier for Arctic air preventing the cold air mass from crossing the mountains spreading towards the West Coast, but not in this case.
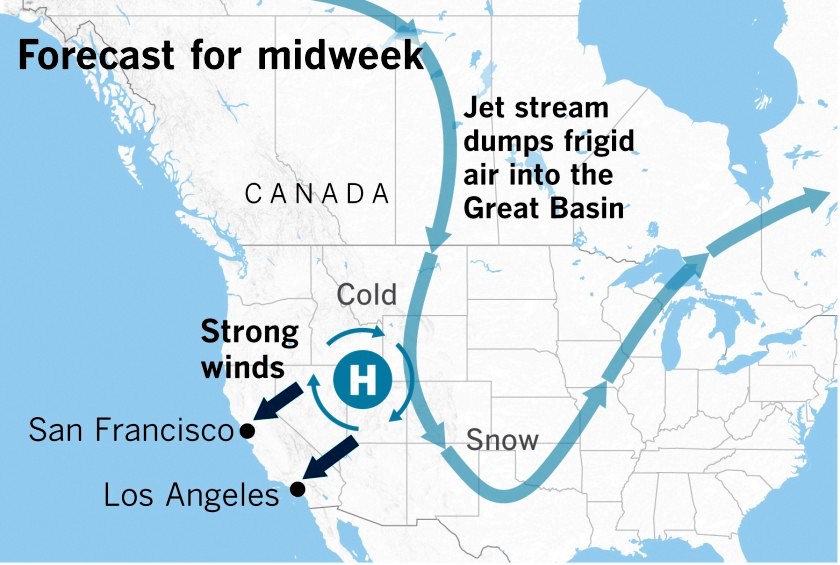
NOAA's map also offers some perspective to the nearly hurricane force winds that have been fanning fires that are raging in California's famous wine country and the Los Angeles area. The air mass pushing past Nevada has provided extra energy to the downslope Santa Ana and Diablo winds that are common on the West Coast during the Fall.
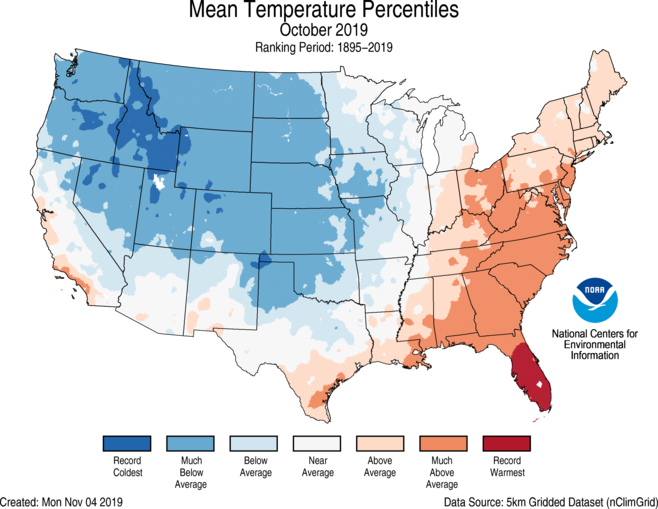
October Temperature anomalies, 11-2019 (credit: NOAA) California Santa Ana and Diablo winds, 10-28-2019 (credit: LAT's)
The events unfolding in the Mid-West, Rocky Mountains, and California are related and all likely carry signals of climate change. Similar weather anomalies occurred in 2018. VOX investigated changes to the jet stream winds showing that as they weaken, storms, droughts, and extreme weather events move further across continental land masses.
Climate disruption is not simply a single phenomenon but actually the amplification of multiple weather events. The Intergovernmental Panel on Climate Change (IPCC) produced a graphic to explain the issue just a few days before the events in California and the Mid-West. The graphic shows how different levels of CO2 induced climate change can be amplified or reduced under different concentrations of the atmospheric gas.
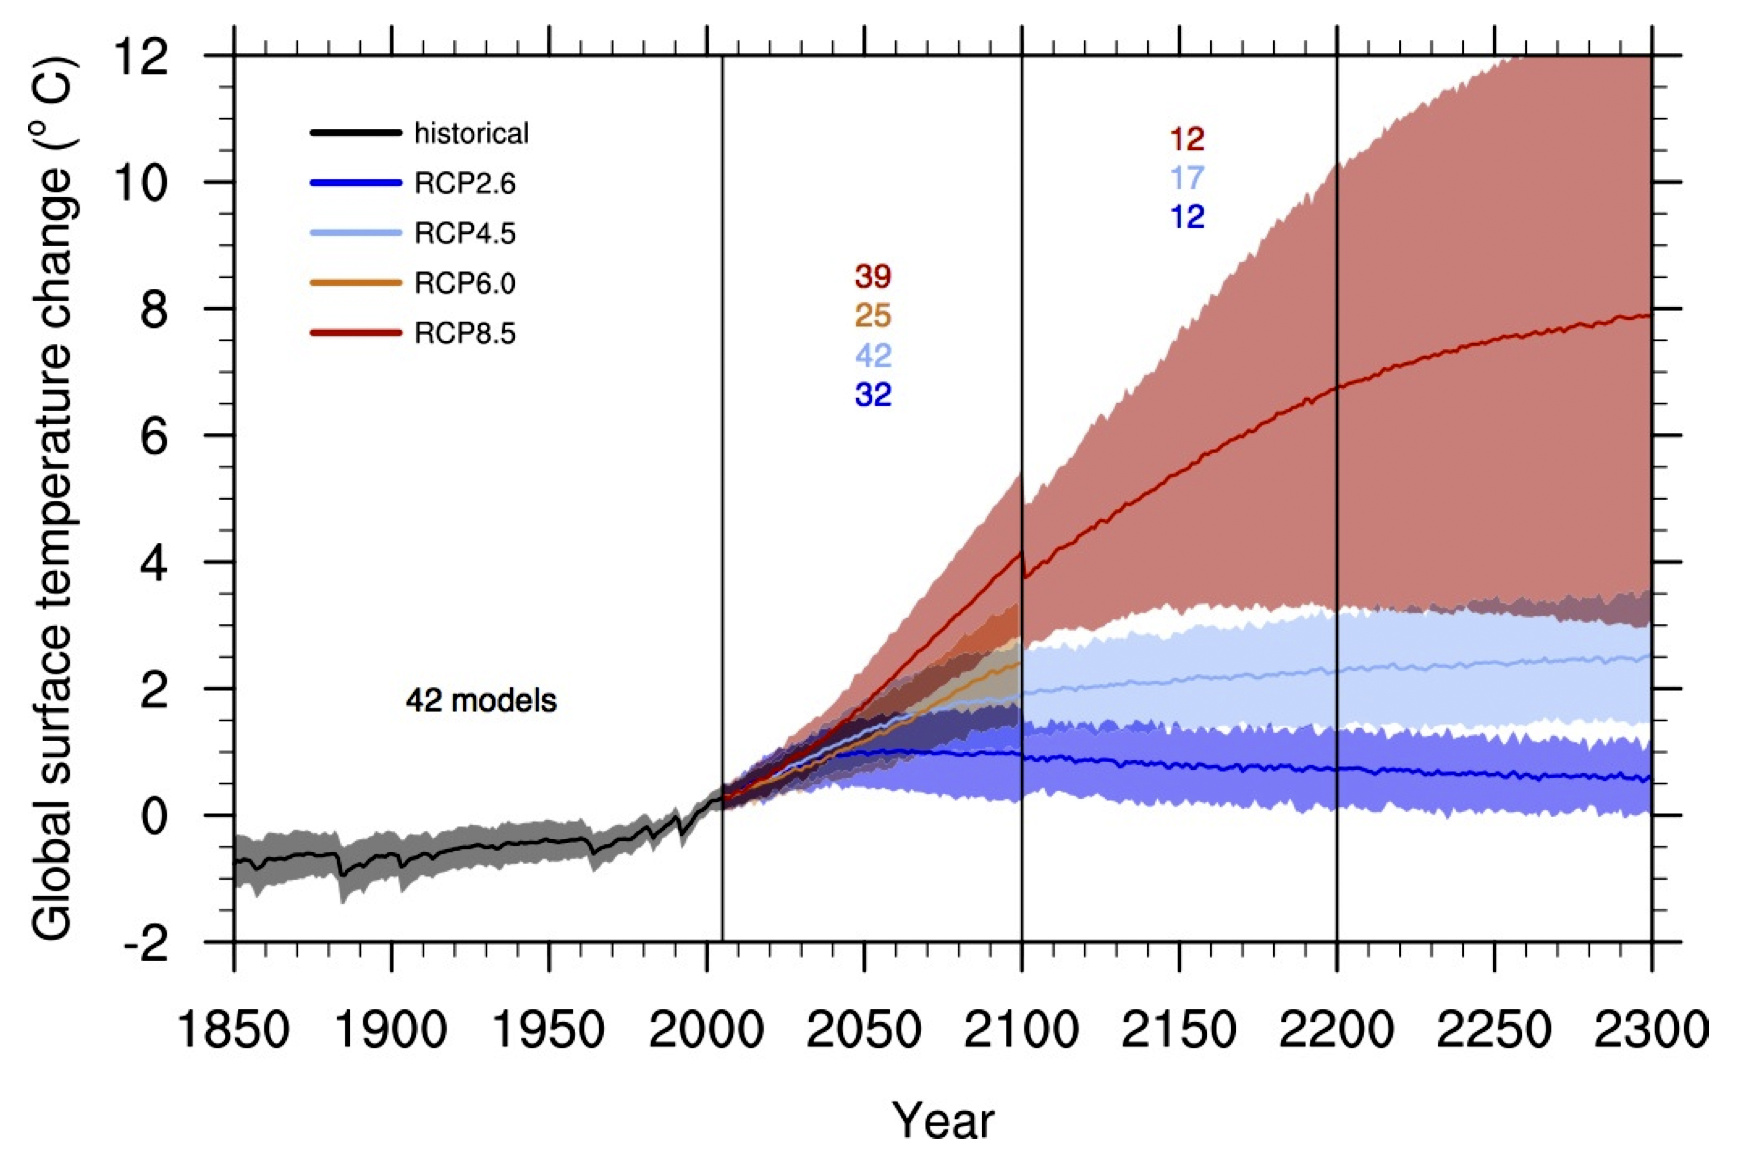
Climate Amplification Curves, 10-26-2019 (credit: IPCC)
Whether you're a trucker driving crossing Wyoming experiencing freeway ice in the early Fall, a Mid-western farmer unable to plant because extreme Spring rains water-logged your fields, a coastal city flooded by a Summer super-hurricane, or a winery burned to the ground from a mega-fire in California, the consequences of a warming world are becoming clearer with every amplified weather event.
WHB